
Go has extensive support for concurrency through goroutines and channels. This feature allows programs to progress on several tasks at the same time but it requires some extra care to prevent situations where multiple goroutines might collide and lead to a panic. These are known as race conditions and they happen when a shared variable is read and written at the same time by two different routines. A typical example is a concurrent read/write of a map in memory.

To illustrate an example let's consider gocontentful, the code generator that creates an API to access a Contentful CMS from go. The generated API uses an in-memory cache to store a copy of a Contentful space and some extra data structures to allow go programs to access Contentful data, inspect and resolve references and so on. In a typical scenario, the client is used in a service that responds to HTTP calls and makes heavy use of concurrency because it needs to be able, at the same time, to:

  • Read entries, assets and references from the cache
  • Update/Delete single entities and their connections with others (for example the map of parent entries)
  • Incrementally sync the content of the cache with data changes coming from Contentful
  • Rebuild the cache entirely and swap the existing one with a new copy

In addition, for performance reasons, when the cache is created or rebuilt the gocontentful client spawns up to four goroutines to download chunks of data in parallel across the Internet, dynamically selecting the size the sorting of the chunks to leverage the maximum parallelism.

Detecting race conditions through unit tests

We experienced race conditions with the client in the past, and we fixed them to maintain it production-ready with every new version. To help with this, we included a testing framework in gocontentful that generates a sample API from a local export of a Contentful space and then runs several unit tests that, among others, test the client for concurrency safety:

make test

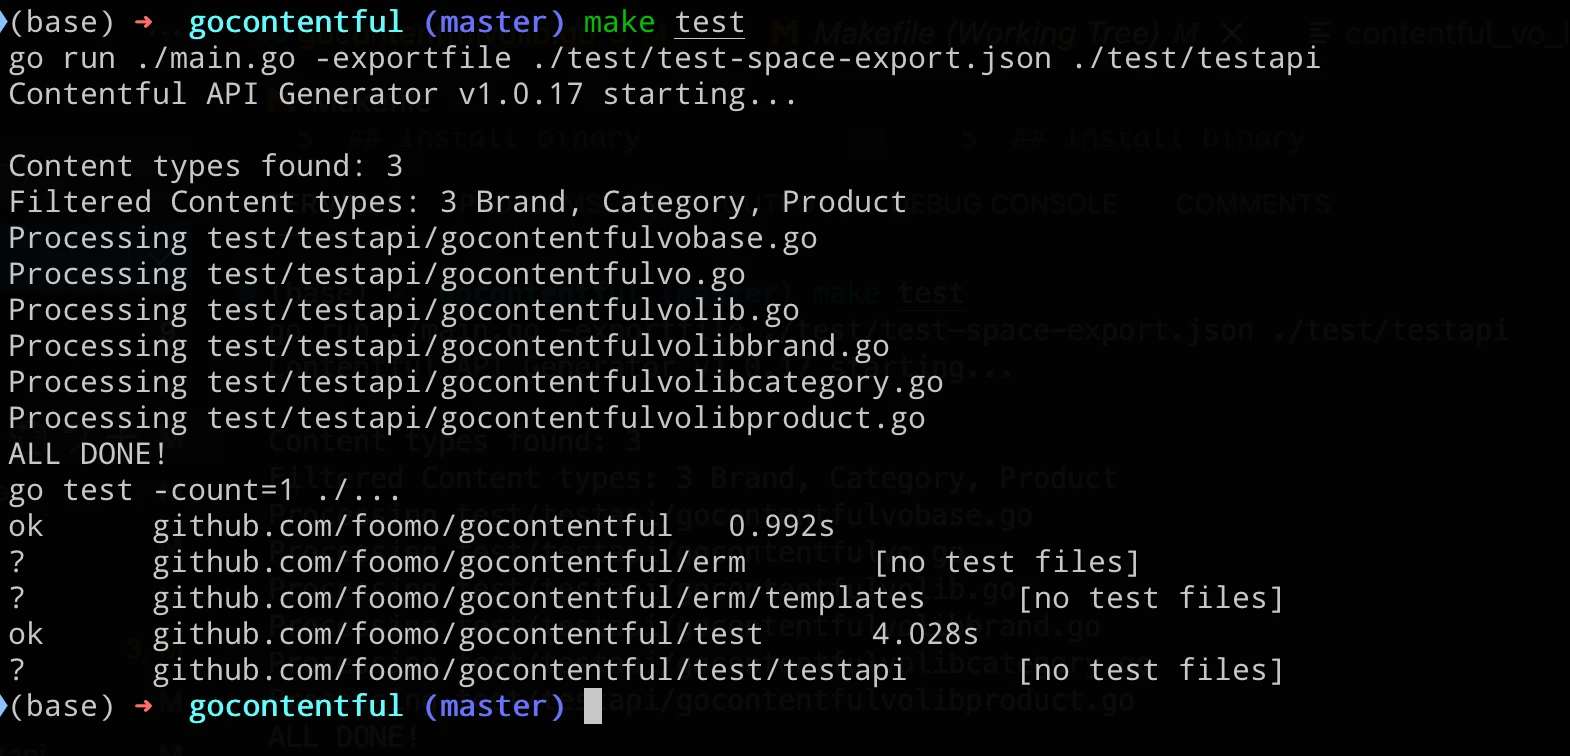
One of these unit tests spawns tens of thousands of goroutines to concurrently read, write and inspect the references of specific entries while at the same time keeps rebuilding the cache. From the screenshot above we see that no race condition is shown. Even at this concurrency level, though there's no guarantee that running

go test ./...

will be enough to generate a collision. What we really want to do is to add a new parameter to enable the go race detector with

go test -race ./...

(In gocontentful you can run make race to fire up both the API generation and the race test)

From the documentation at https://go.dev/blog/race-detector:

When the -race command-line flag is set, the compiler instruments all memory accesses with code that records when and how the memory was accessed, while the runtime library watches for unsynchronized accesses to shared variables. When such “racy” behavior is detected, a warning is printed.

Running this in gocontentful shows that we indeed have a potential collision condition:

Race condition

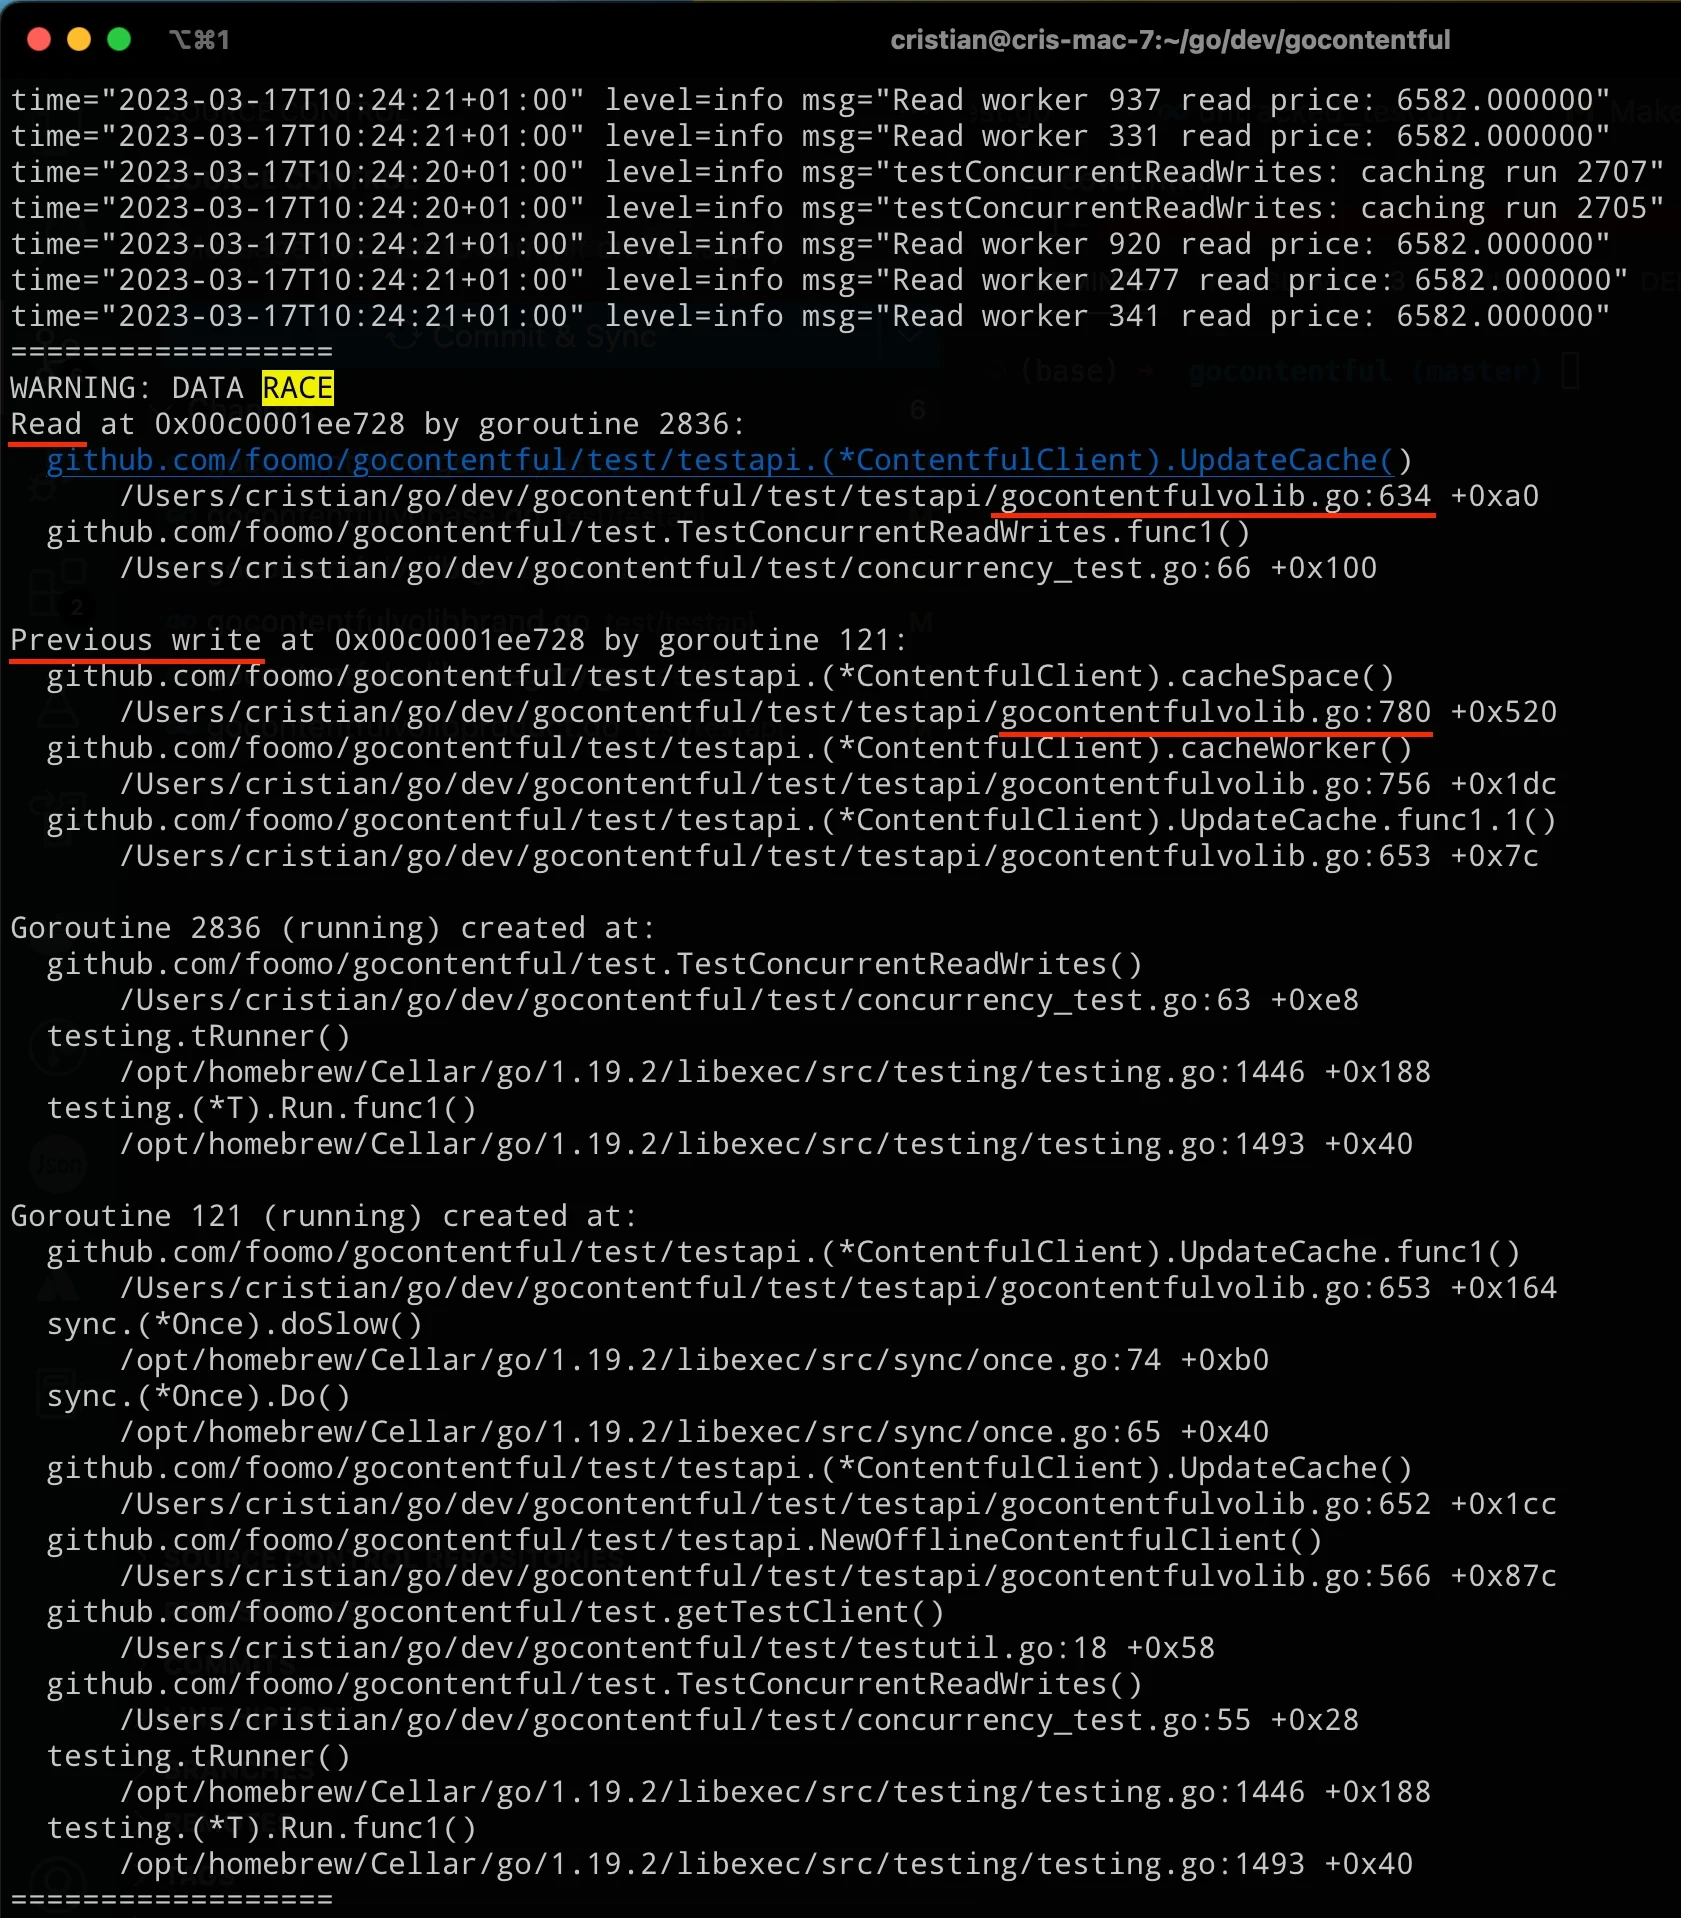
Note: After you run this test you'll want to search for "race" inside the terminal output. Make sure you enable a very long (if not infinite) scrollback or you might miss some hits.

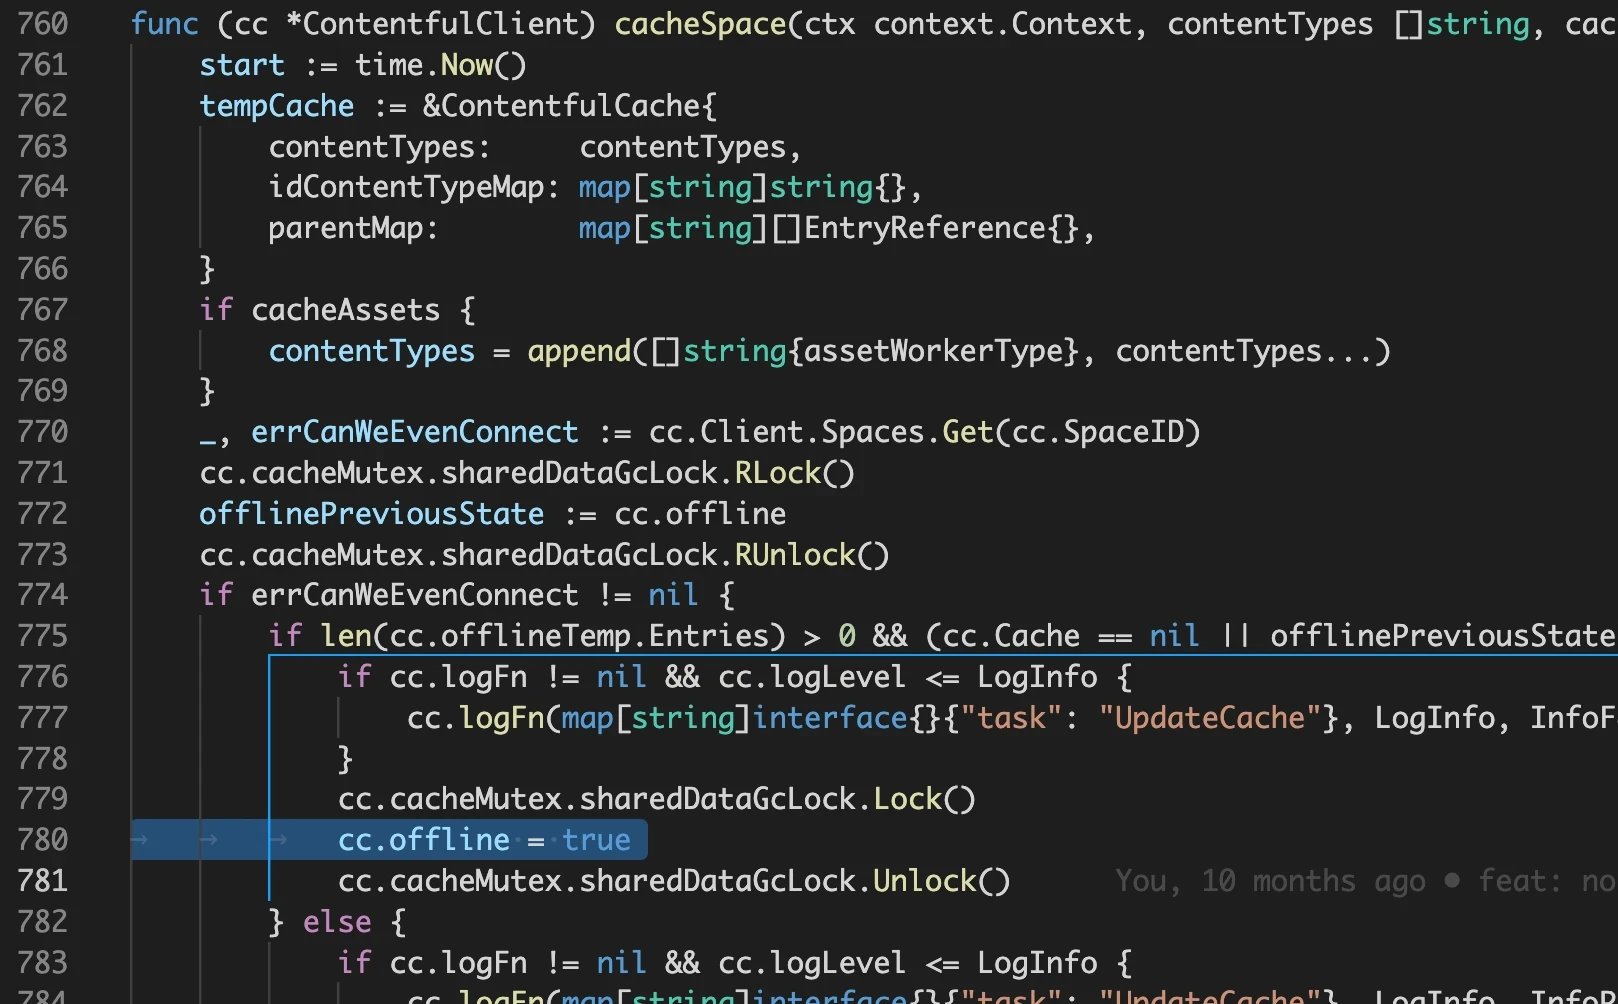
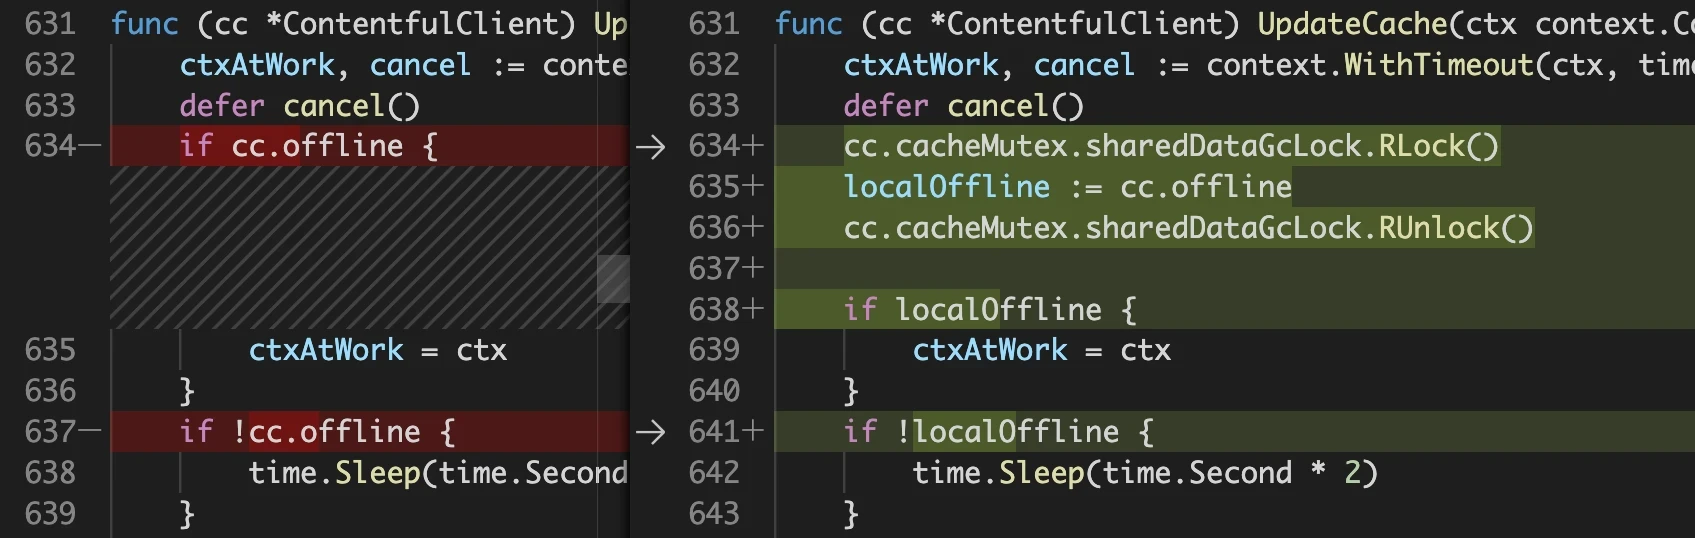
The race detector reports the filenames and lines of code that generated the race condition. Looking at those lines in our example shows that a field of the cache (the "offline" boolean) is written protecting it with a proper mutex lock but the lock handling is missing around the read operation:

Read access

Write access

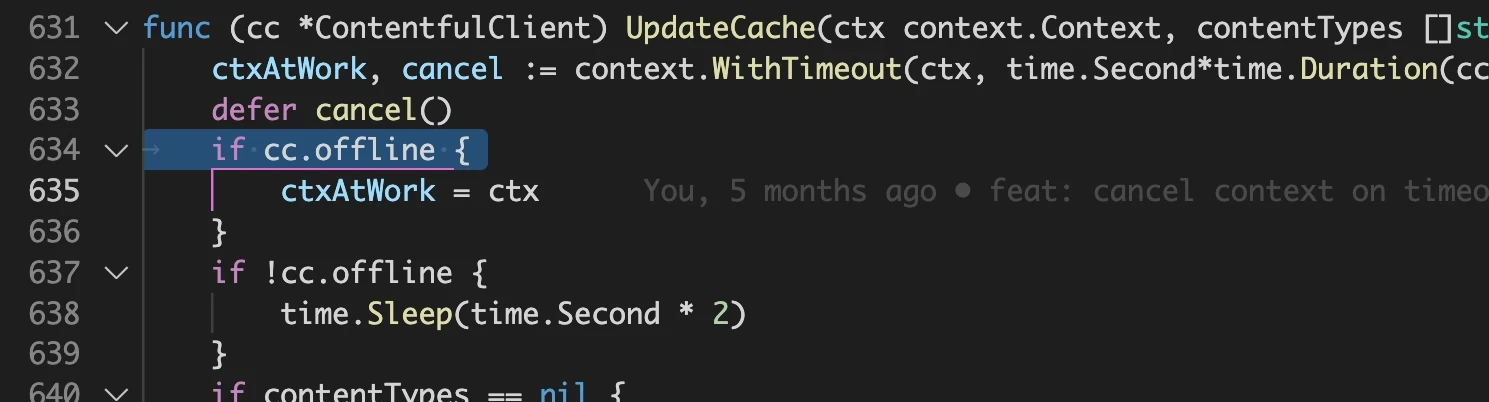
The fix is very simple but in this particular case the offline flag is read and then a 2 seconds delay is started. Deferring the unlock would keep the variable locked for far too long, so we will read-lock it only for the time needed to copy its value to a local variable:

Fix race condition

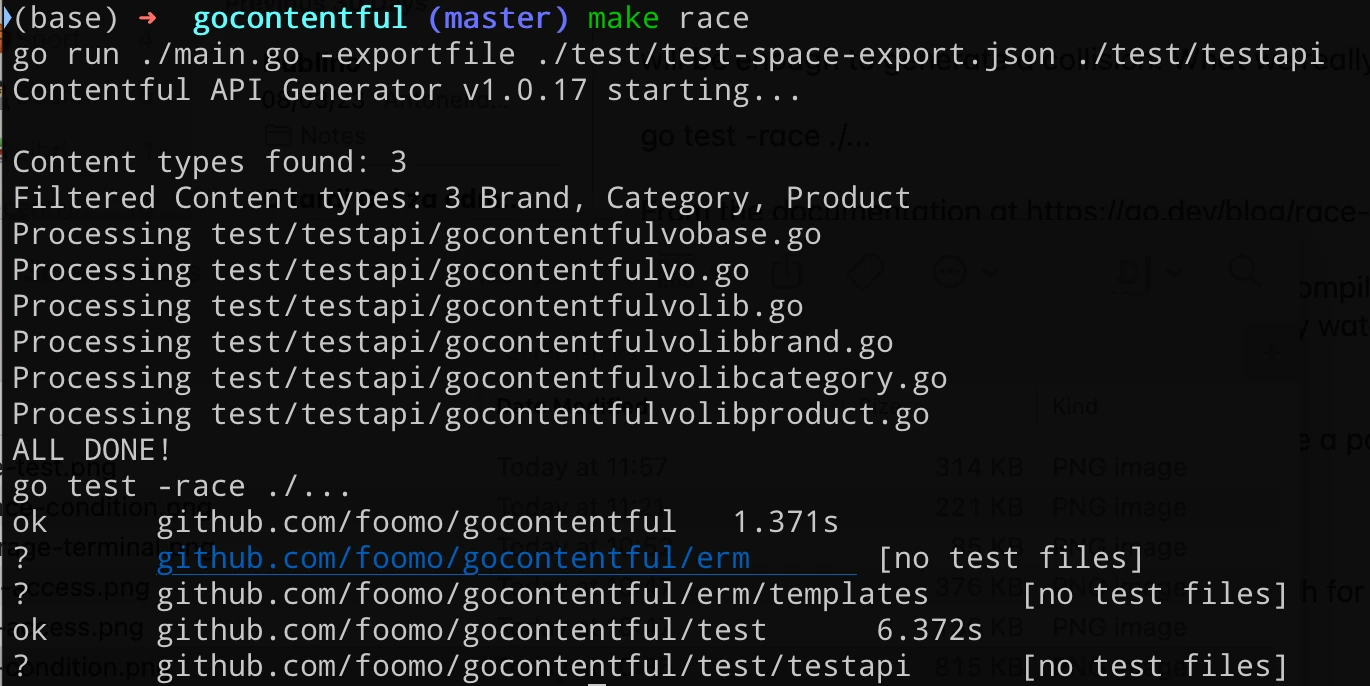
After fixing the issue in the generator templates and regenerating the code, the tests with the race detector run fine. In gocontentful this can be done all in one step with make race:

No race condition

Test coverage

That was nice! But how do we know if we're covering all test cases? Go has been supporting test code coverage since 1.12 through the -cover option. We can also limit the coverage to a specific package. In our case, we're only interested in the testapi sub-package because we want to test the generated API, not the generator itself.

go test -cover -coverpkg=./test/testapi ./...

Let's try and run the tests with coverage:

Basic coverage

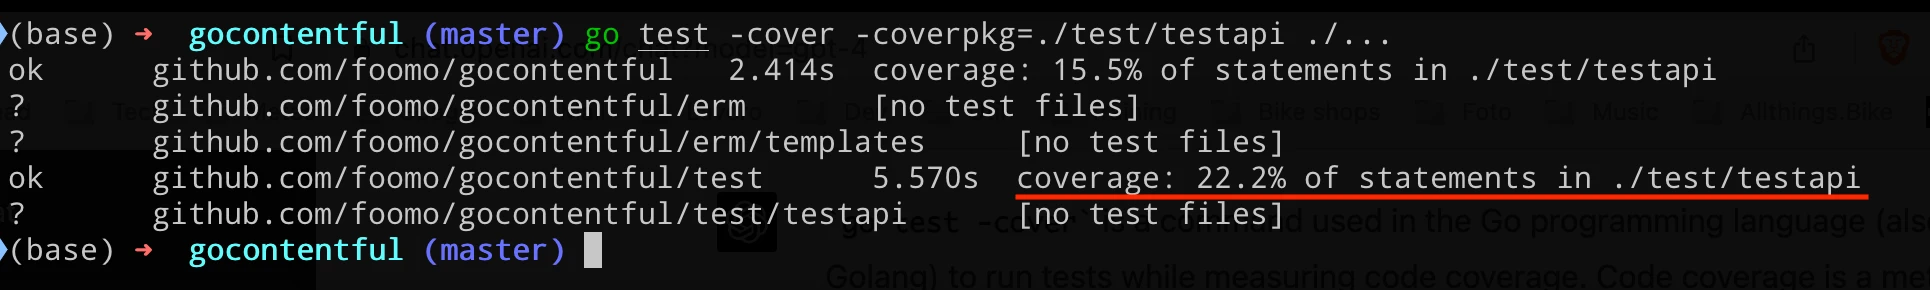
The summary shows we are only covering 22% of the code. The goal is not to cover 100%, some parts only work online calling the actual API of a real Contentful space, but we definitely have room for improvement.

The question is: how do we know exactly which lines of code we're covering through the test suite? Again, go test comes to the rescue through another option: -coverprofile lets us specify an output file that will contain references to each single line of code involved in the analysis. It is a text file, but not very readable:

github.com/foom...tapi/gocontentfulvolibproduct.go:21.86,22.15 1 1
github.com/foom...tapi/gocontentfulvolibproduct.go:25.2,25.18 1 1
github.com/foom...tapi/gocontentfulvolibproduct.go:28.2,29.16 2 0
github.com/foom...tapi/gocontentfulvolibproduct.go:32.2,33.16 2 0
github.com/foom...tapi/gocontentfulvolibproduct.go:36.2,37.37 2 0
github.com/foom...tapi/gocontentfulvolibproduct.go:40.2,40.24 1 0
github.com/foom...tapi/gocontentfulvolibproduct.go:22.15,24.3 1 0
github.com/foom...tapi/gocontentfulvolibproduct.go:25.18,27.3 1 1
github.com/foom...tapi/gocontentfulvolibproduct.go:29.16,31.3 1 0
github.com/foom...tapi/gocontentfulvolibproduct.go:33.16,35.3 1 0
github.com/foom...tapi/gocontentfulvolibproduct.go:37.37,39.3 1 0
github.com/foom...tapi/gocontentfulvolibproduct.go:43.114,44.35 1 0
github.com/foom...tapi/gocontentfulvolibproduct.go:47.2,48.18 2 0
github.com/foom...tapi/gocontentfulvolibproduct.go:51.2,53.16 3 0
github.com/foom...tapi/gocontentfulvolibproduct.go:56.2,57.16 2 0
...

We can use go tool to convert it to a much better representation in HTML:

go tool cover -html=cover.out -o cover.html

Opening this file in a browser reveals a lot of useful information:

Coverage HTML

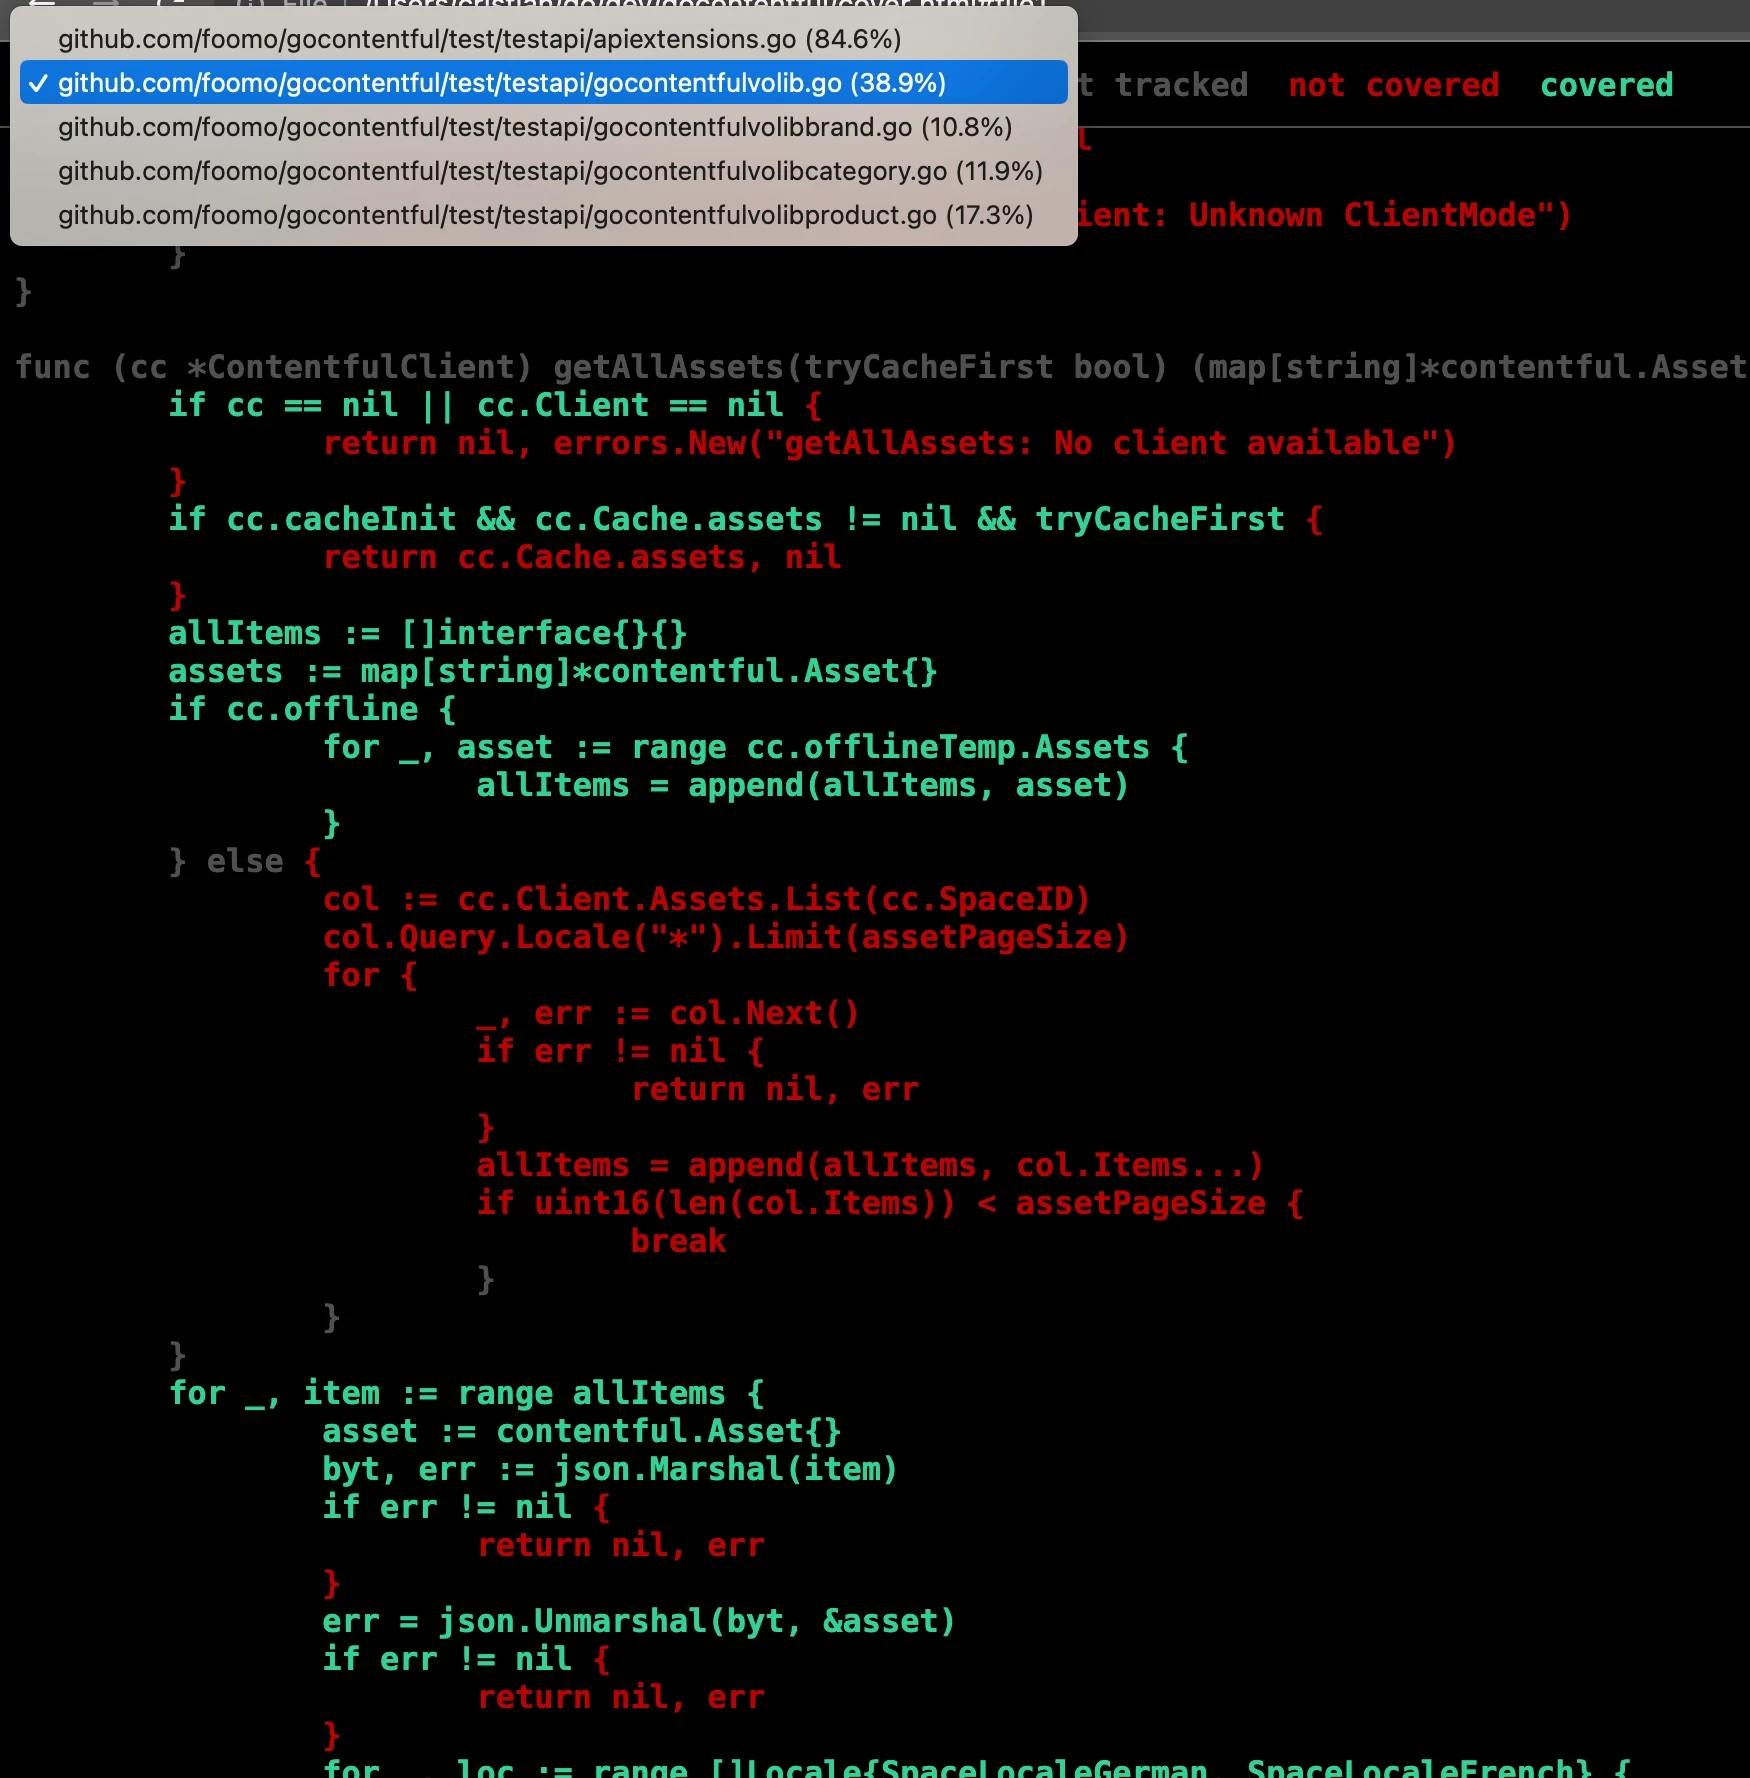
At the top left of the page there's a menu where we can select from all the files analyzed, listed along with the percentage of coverage for each one. Inside every file the lines covered by the tests are green while the red ones are not covered. In the example above we can see that the getAllAssets function is covered but it includes an else condition that is never met.

In gocontentful (starting from 1.0.18) we can generate the test API, run the tests with coverage, convert the output file and open it in the browser with a single command:

make cover

As stated above, not necessarily 100% of the code needs to be covered by the tests, but this view in combination with the race detector gives us incredibly useful information to make the code more solid.

Intro

Calculating with money can be tricky if not taken proper precautions. Some might be tempted to use float representation for calculating with currency values. That is problematic because of possible rounding errors.

Finite accuracy of representation

Floating points are represented like this

Floating point representation

Not every number can be represented with a finite number of decimal places

0.01 —> 0.0000011001100110011…

Taking 17 places of the above results in 0.010000000000000001

Consider the following code snipet that shows the missing accuracy

func main() {

  var n float64 = 0

  for i := 0; i < 1000; i++ {
    n += .01
  }

  fmt.Println(n)

}

Result: 9.999999999999831

Money computations

They can't be done with floating-point as it would inevitably lead to rounding errors.

Even the following packages are problematic:

github.com/shopspring/decimal

github.com/Rhymond/go-money

a := decimal.NewFromInt(2)
b := decimal.NewFromFloat(300.99)
c := a.Mul(b)
d := c.Div(decimal.NewFromInt(3))

Solution

Use Int by representing money in cents:

  • 10.99 -> 1099 (cents)
  • 10.9900 -> 109900 (4 digit tax)

Conclusion

Division is a problem!

1/3 - > 0.33333333… Correct way: 0.33, 0.33, 0.34

When doing money calculations one should avoid division as it inevitably leads to loss of accuracy. When dividing make sure to round to cent and deal with diffs.

Division by 10^k is ok as long as we are inside of the range of the data type.

Nicola Turcato

Intro

JavaScript is parsed, compiled and executed in the main thread of the browser. Which means that users have to wait for all of this before they can interact with the website.

Frontend performance optimization is critical because it accounts for around 80-90% of user response time (10-20% backend). So when a user is waiting for a page to load, around 80-90% of the time is due to frontend related code and assets.

Nobody likes waiting…

A study found that if a site takes longer than 4 seconds to load, up to 25% of users would abandon the site.

Sending large JavaScript payloads impacts the speed of your site significantly.

Mazzarri

What is a "bundle"?

Your frontend application needs a bunch of JS files to run. These files can be in the format of internal dependency like the JS files you have written yourself. But they can also be external dependencies you use to build your application.

JS bundling is an optimization technique to reduce the number of server requests for JavaScript files. Bundling accomplishes this by merging multiple JA files together into one file to reduce the number of page requests.

Bundle Everywhere

Performance implications

  • Time to transmit over the network: considering slow connections with some mobile devices, it's possible that your page will not be interactive until it loads.-> More bytes = longer download times
  • JS parse and compile time: more code you load, more the browser must parse.-> JS gets parsed and compiled on the main thread, when the main thread is busy, the page can't respond to user input
  • JS execution time: optimally you will only pack the code that you expect to execute. The more code you want to execute the longer it will take. It's possible that your page won't be interactive until some of this completes.-> JS is also executed on the main thread, if your page runs a lot of code before it's really needed, that also delays your Time to Interactive
  • Memory consumption: everything fills up the space -> code itself, runtime variables, DOM elements created, etc.-> Pages appear slow when it consumes a lot of memory. Memory leaks can cause your page to freeze up completely!!

AS SMALL AS POSSIBLE! I experienced that is not really possible to give a precise answer because each application is different. Generally you want the resources on initial load to be as small as possible, so that you decrease the initial load time, and then load more resources as needed on the fly.

Mr Chao

What do we do then?

Meh

How to start decreasing the bundle size?

  • Measure: first of all you want to measure. The first step is to use Lighthouse and try to understand the results. It will give you a couple of interesting metrics and some tips. Time to interactive (TTI) is a good reflection of your bundle size because your bundle needs to be evaluated entirely before a user can interact with your web app.
  • Analyze: Consists on analyzing the bundle in order to detect critical chunks. A useful tool is Webpack Bundle Analyzer.

Stonks

Breaking up the bundle...

  • Monitor network requests: These happens between our FCP and TTI. As the initial request for data often occurs when our components initially mount.
  • Reduce the total dom nodes: the less the page needs to render, the less time it takes.
  • Moving work off the main thread: By moving heavy computations to a web worker, the computation will be run on a separate thread, and not block the actual rendering of the page
  • Caching: Even if not useful for users on first page landing, caching data, bundles, and assets can make subsequent visits way fast

Breaking Bad

Which strategies can we adopt?

  • Minification and Dead Code Elimination: These processes are often summed up as minifying or uglifying.
  • Tree shaking: Tree shaking is dead code elimination on a project or library. Always try to use deps which support “tree shaking”, Bundlephobia could be your friend in this case.
  • Code Splitting and Lazy Loading: Code splitting consists on taking a collection of modules and remove them from the main JS bundle. Lazy loading means we can load this newly created bundle later on.
  • Replace/rewrite large dependencies: Consider replacing or rewriting libraries that are large in size where you might not need all of its functionalities (Moment.js for example).
  • Feature module import: Check to see if you are using only a feature module of the library that can be imported alone without importing the whole library (Lodash for example).

Strategy

Useful tools to help you reducing bundle size

  • Lighthouse: automated tool for improving the performance, quality, and correctness of your web apps
  • Bundlephobia: Bundlephobia helps you find the performance impact of npm packages
  • Webpack Bundle Analyzer: analyzes your bundle
  • VS Code: Import Cost plugin -> Display import/require package size in the editor

Tools

Conclusion

Performance cannot be stripped down to a single metric such as bundle size. It would be great! Unfortunately there is no single place to measure all of them.I think metrics like the Core Web Vitals and a general look at bundle size should be considered as a starting point. You will cry... A lot... But don’t give up!

The End

The Annoyance

So, we've all been there. You go to your trusty grafana, search for some sweet metrics that you implemented and WHAM! Prometheus returns us a 503, a trusty way of saying I'm not ready, and I'm probably going to die soon. And since we're running in kubernetes I'm going to die soon, again and again. And you're getting reports from your colleagues that prometheus is not responding. And you can't ignore them anymore.

Bummer.

The Problem

All right, lets check what's happening to the little guy.

kubectl get pods -n monitoring

prometheus-prometheus-kube-prometheus-prometheus-0       1/2     Running   4          5m

It seems like it's stuck in the running state, where the container is not yet ready. Let's describe the deployment, to check out what's happening.

     State:          Running                                                                                                                                                                                                                        │
       Started:      Wed, 12 Jan 2022 15:12:49 +0100                                                                                                                                                                                                │
     Last State:     Terminated                                                                                                                                                                                                                     │
       Reason:       OOMKilled                                                                                                                                                                                                                      │
       Exit Code:    137                                                                                                                                                                                                                            │
       Started:      Tue, 11 Jan 2022 17:14:41 +0100                                                                                                                                                                                                │
       Finished:     Wed, 12 Jan 2022 15:12:47 +0100                                                                                                                                                                                                │

So we see that the prometheus is in a running state waiting for the readiness probe to trigger, probably working on recovering from Write Ahead Log (WAL). This could be an issue where prometheus is recovering from an error, or a restart and does not have enough memory to write everything in the WAL. We could be running into an issue where we set the request/limits memory lower than the prometheus requires, and the kube scheduler keeps killing prometheus for wanting more memory.

For this case, we could give it more memory to work to see if it recovers. We should also analyze why the prometheus WAL is getting clogged up.

In essence, we want to check what has changed so that we suddenly have a high memory spike in our sweet, sweet environment.

The Source

Cardinality

A lot of prometheus issues revolve around cardinality. Memory spikes that break your deployment? Cardinality. Prometheus dragging its feet like it's Monday after the log4j (the second one ofc) zero day security breach? Cardinality. Not getting that raise since you worked hard the past 16 years without wavering? You bet your ass it's cardinality. So, as you can see much of life's problems can be accredited to cardinality.

In short cardinality of your metrics is the combination of all label values per metric. For example, if our metric http_request_total had a label response code, and let's say we support 8 status codes, our cardinality starts off at 8. For good measure we want to record the HTTP verb for the request. We support GET POST PUT HEAD which would put the cardinality to 4*8=32. Now, if someone adds a URL to the metric label (!!VERY BAD IDEA!!, but bare with me now) and we have 2 active pages, we'd have a cardinality of 2*4*8=64. But, imagine someone starts scraping your website for potential vulnerabilities. Imagine all the URLs that will appear, most likely only once.

mywebsite.com/admin.php
mywebsite.com/wp/admin.php
mywebsite.com/?utm_source=GUID
...

This would blow up our cardinality to kingdom come. Like you will be out of memory faster than "a new super awesome Javascript gamechanger framework" is born. Or to quote user naveen17797 Scientists predict the number of js frameworks may exceed human population by 2020,at that point of time random string generators will be used to name those frameworks.

The point to this story is, be very mindful of how you use labels and cardinality in prometheus, since that will indeed have great impact on your prometheus performance.

The Solution

Since this has never happened to me (never-ever) I found the following solution to be handy. Since we can't get prometheus up and running to utilize PromQL to detect the potential issues, we have to find another way to detect high cardinality. Therefore, we might want to get our hands dirty with some kubectl exec -it -n monitoring pods/prometheus-prometheus-kube-prometheus-prometheus-0 -- sh, and run the prometheus tsdb analysis too.

/prometheus $ promtool tsdb analyze .

Which produced the result.

> Block ID: 01FT8E8YY4THHZ2S7C3G04GJMG
> Duration: 1h59m59.997s
> Series: 564171
> Label names: 285
> Postings (unique label pairs): 21139
> Postings entries (total label pairs): 6423664
>
> ...
>
> Highest cardinality metric names:
> 11340 haproxy_server_http_responses_total
> ...

We see the potential issue here, where the haproxy_server_http_responses_total metric is having a super-high cardinality which is growing. We need to deal with it, so that our prometheus instance can breathe again. In this particular case, the solution was updating the haproxy.

... or burn it, up to you.

Flame Thrower

The Further Reading

  1. WAL Definition
  2. WAL & Checkpoints
  3. Using TSDB
  4. Biggest Metrics
  5. Cardinality

Jan Halfar

While building this website and integrating https://docsearch.algolia.com and evaluating another solution by a large company in parallel I could not help to search github and the web for the current state of search engines and search related services.

Since I had done the same thing about a year ago, I was surprised to see how quickly things are moving atm.

Algolia

I was blown away by the quality of https://www.algolia.com and I wish it was open source, but I guess, we all have to make a living ;)

To see how awesome a web (search) interface can be check out https://www.lacoste.com/us/#query=red%20jackets%20for%20men

Apart from that the UI/UX of their backend tools is fantastic.

Elastic

When it comes to https://www.elastic.com I am a bit nervous about the future of the licensing, despite the fact, that I understand their motivation. At the same time the https://opensearch.org does not seem to be an ampty threat.

typesense.org

I do not know, who was hiding under a rock, but I had not seen https://typesense.org before and they certainly have a bold claim: "The Open Source Algolia Alternative" / "The Easier To Use ElasticSearch Alternative"

When looking at https://github.com/typesense/typesense/graphs/contributors it seems, that Kishore Nallan has been working on this for a while. Unfourtunately I do not really see a lot of external contributions, C++ does not seem to attract a lot of contribution.

MeiliSearch

This Rust project https://www.meilisearch.com/ seems to be picking up speed and is definetly on the test short list. It is a fresh codebase with siginficant open source contributions and certainly will attract new developers with Rust and a modern architecture.

Go eco system

Obviously we are very interested in Go powered software and there are a few notable projects. ATM I do not see anything elastic or algolia like, that would be really mature.

bleve / bluge

Marty Schoch seems to be the man when it comes down to text indexing libraries in written in Go and bluge seems to be THE library, that is solid and modern, when implementing text search in your Go application.

https://github.com/blevesearch/bleve https://github.com/blugelabs/bluge // next iteration of bleve

projects using bluge

All bleeding edge afaik atm - but definitely good places to look at bluge usage

https://github.com/prabhatsharma/zinc https://github.com/mosuka/phalanx

Look ma I made a vector database

Gotta take a look at this one - will report later

https://github.com/semi-technologies/weaviate

Marko Trebižan

Issue with performance

When building an ecommerce site or an application where performance is a great deal for the users, you need to keep your application fast and responsive. Frontend developers have already many use-cases when the UI becomes laggy and this increases when 3rd party scripts are being included, such as Google Tag Manager or various Live chats (e.g. Intercom).

This does not only influences the users when using the site but also Lighthouse score gets lower which also influences page rankings. So the most naive and easy way for this is to defer loading of such scripts but when you need to get all the data from the start of the application, such tactic is not an option. So what else can we do?

Partytown to the rescue

Developers at BuilderIO created an library Partytown that would allow relocating resources from 3rd party scripts off the main thread. We won't dive into specifics how it works, because they explain it nicely on their GitHub page.

In our stack we use Next.js React framework and we will go through the basic steps that will allow us to include Partytown for Google Tag Manager.

Setup

Partytown script needs to be located inside our application and live on the same domain. Since we're using monorepo structure, we need to copy this script across all our frontend application. For that we used CopyPlugin webpack plugin in our Next.js config file:

config.plugins.push(
      ...
      new CopyPlugin({
        patterns: [
          {
            // we copy script from node_modules partytown package to `~partytown` folder in our package that serves static files
            from: path.join(path.dirname(require.resolve('@builder.io/partytown')), 'lib'),
            // paths for SSR and client side rendering differ
            to: path.join(`${isServer ? '..' : '.'}/static/assets/`, '~partytown'),
          },
        ],
      })
    );

Partytown's requirement is that it needs to know what script should it load into own web worker. For that we set script type to text/partytown. This will prevent script to load on initial load.

Inside _document.tsx we add this:

<Head>
    ...
    // include Partytown and set custom path due to multiple frontends
    <Partytown lib={`${addTrailingSlash(this.props.basePath)}_next/static/assets/~partytown/`} debug={false} />
    // tag 3rd party script with partytown type
    <script type="text/partytown" src={`https://www.googletagmanager.com/gtm.js?id=${id}`} />
    ...
</Head>

Results

So now, does it work? We used one of our large Ecommerce sites to test the landing Lighthouse score.

This was before adding Partytown:

Lighthouse before Partytown

Here you can see 2 critical things: almost 1s of total blocking time (TBT) and 9s of time to interactive (TTI).

After we added Partytown, we got this:

Lighthouse after Partytown

Time to interactive went from 9s to 6.1s which is almost 33% improvement and total blocking time was reduce by more than 50%! We were more than impressed how easy it was to improve our performances.

Side note: Both screenshots were compressed using Squoosh App.

Next steps

After successful testing of Partytown for Google Tag Manager script, we are more than interested in trying it out on our other scripts. One important topic will be to test Partytown with other service-worker related libraries and how to use them together.

Jan Halfar

A few years ago we abandoned the previous version of https://www.foomo.org as we did not want to maintain the old wordpress installation and the project was only living in README.md in the repos living under https://www.github.com/foomo .

As things have grown over time we have decided to re-launch a website / cross project documentation.

So welcome back and enjoy the view to the past:

blast from the past